M A S T E R P A G E
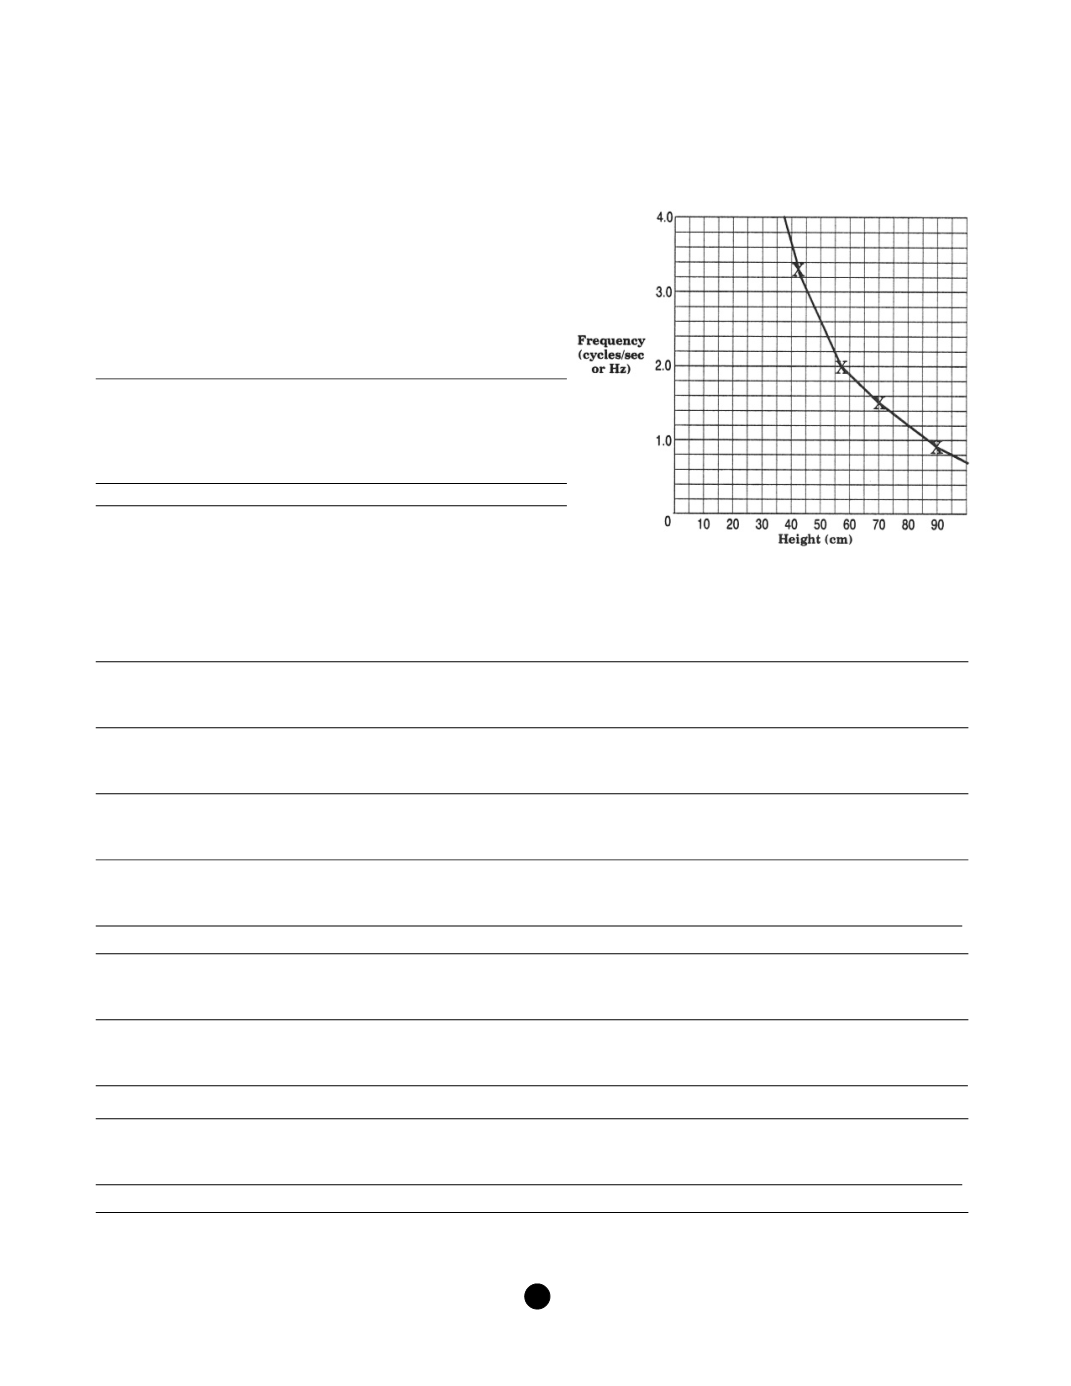
3. Plot the height versus the natural frequency of each rod
assembly on the graph provided. You should have four data
points. Connect the points with the best fitting straight or
curved line you can.
4. What kind of line did you get from your data?
A symmetrical curve, or hyperbolic curve.
5. As the height of the rod assemblies gets larger, what
happens to their natural frequency?
As the height increases, the natural frequency decreases.
C. Summary
1. What variable is manipulated in this experiment? (How do the four rod assemblies differ from each other?)
The height of the rods varies.
2. What is the responding variable in this experiment? (What did you measure?)
The natural frequency of each rod assembly.
3. What does oscillate, or vibrate, mean?
Wiggle back and forth, or move repetitively.
4. Define
frequency
.
In this case, the frequency is the number of oscillations per second.
5. Why does only one rod assembly oscillate greatly (or resonate) when you wiggle the base?
The vibration only adds up in one rod, or only one rod will resonate at each shaking.
You have found the rod’s natural frequency.
6. What is resonance?
When a structure is vibrated at its natural frequency, the vibrations add up. This is called resonance.
7. How are the rod assemblies like buildings?
They have mass that is attached to the base by a structure.
Or—They have fixed bases attached to freely oscillating tops by tall, stiff structures.
8. (
extra
credit
) How can a building be protected from resonating with seismic vibrations?
Dampen the building’s vibration with something like the shock absorbers on a car.
Isolate the base of the building from the ground. (Accept other reasonable suggestions.)
A G U
/
F E M A
257
S
E I S M I C
S
L E U T H S


